

From jargon to impact: Teaching undergraduates the art of public communication
Seth T. Kannarr, Southern Illinois University Edwardsville; Derek H. Alderman, University of Tennessee, and Katrina Stack, University of South Florida
Articles published in The Conversation go well beyond academics writing for a general audience – they can also serve as great content for educators to use in the classroom.
Our recent article in the academic journal The Professional Geographer explores how articles from The Conversation provide opportunities for public storytelling and authentic learning in university classrooms.
As geographers and experienced writers for The Conversation – having written or co-written 26 articles since 2017 – we understand firsthand the value of disseminating these short, open-access articles that can be easily republished under the Creative Commons license.
To this point, one of the top republishers for The Conversation is Actively Learn, a McGraw Hill platform used to provide standards-aligned content for K–12 educators.
Yet we feel that The Conversation’s potential contributions to university education have not been sufficiently explored, which is unexpected given that its articles are authored by college teachers and researchers.
Why it matters
Public storytelling is increasingly important for scholars as higher education faces increased scrutiny, politicized attacks on truth-telling, pressure to show broader relevance and calls to regain trust.
In our article, we argue for integrating more public-facing science communication into educational spaces. We also introduce our use of articles from The Conversation as a classroom tool and discuss coaching students through challenges they face.
Our pedagogical work may interest university educators in other fields looking for ways to engage their classrooms in “authentic learning” – that is, learning in real-world contexts – and incorporate public storytelling into the professional preparation of their students.
Authentic learning gives students opportunities to observe how subject experts apply academic research to address social, political and environmental issues and contribute to public and policy debates and decisions beyond the classroom.
We choose to use articles from The Conversation in pedagogical exercises because we want to challenge students to confront societal issues from new perspectives. The goal is to do our part as university educators to help produce scholar-citizens ready for civic engagement.
Opportunity for a final deliverable
For example, in an end-of-semester writing assignment we have hosted, students were tasked with selecting a pressing issue in the course’s scope and writing a short article in the style of The Conversation.
Students were asked to draft a “pitch” for an article before writing it, just like prospective authors do for The Conversation. They were asked to make revisions, think through how to support their claims with evidence and adapt to the various conventions of writing for the public, similar to how it may go in working with the editorial team.
Although it is a sometimes difficult and often humbling process for the students to go through, they in real time understand the struggle of writing concisely and interestingly for a general audience.
They also produce a well-written short article that they can be proud of and potentially publish in an appropriate outlet or include in a portfolio for a potential employer.
Although The Conversation does not allow undergraduate students or community partners to go through the process of submitting a pitch and drafting an article to be published, our previous students have shown their ability to punch above their weight and produce short articles that demonstrate their applied and rigorous understanding of course concepts.
Why we write
As scholars, we like to write for The Conversation for four primary reasons:
First, we love the challenge of taking our discipline-specific academic work and translating it into jargon-free, accessible writing that anyone in our family or community could easily read.
This can be a difficult process – especially in taking complex academic concepts and breaking them down into simpler language while keeping essential rigor and nuance. The editors we work with from The Conversation are helpful in this case – even if the process is sometimes maddening along the way.
Second, we love tracking the readership of the published pieces in The Conversation’s dashboard portal. It is exciting to see a recently published article cross a threshold, such as 70,000 reads, over a period of time – something you would never experience from a traditionally published academic journal article.
These aren’t just numbers for us – it’s an indication of the potential impact of our work.
Third, we love how easy it is to share our articles via social media or via DOI links. Additionally, when other news and media outlets republish our pieces via the Creative Commons license, our work gets disseminated widely.
There is no paywall preventing access, no login or account required. Our wider communities can read the short piece by simply clicking a link that can be texted to them.
Fourth, our previous articles published in The Conversation are great sources for assigned reading in our seminar courses. They often cover content that we teach in our courses and are written in our voices. They also are short and easy to read for busy students – while laden with helpful hyperlinks to sources to explore further.
Writing for The Conversation allows us to produce accessible course content that we can use and share for years to come. From our experiences, students who read the articles have enjoyed them as much as we do, because they are quick reads and written in an interesting and accessible manner.
What is next
Further research studies could be done to quantitatively measure student learning outcomes when using articles from The Conversation.
Although our published article is helpful in providing anecdotal insights of the results we have seen from our experiences, more research would allow for further ways to measure the impact of using these articles in the classroom.
We believe The Conversation can help higher education even further by having teams or boards of educators working together to assemble college classroom e-books of articles organized around certain themes of instruction. This expansion of academic insights can help our students, who represent future civic decision-makers and public storytellers.
Regardless of future research opportunities, educators can choose to integrate articles from The Conversation into their classrooms now – whether using these articles for assigned content reading or for creative writing exercises.
We have seen firsthand the benefits of doing so, and we encourage more educators to join us. In doing so, your students can join the broader public conversation – with the power of The Conversation.
Seth T. Kannarr, Visiting Honors Lecturer, Southern Illinois University Edwardsville; Derek H. Alderman, Chancellor’s Professor of Geography, University of Tennessee, and Katrina Stack, Assistant Professor of U.S. Public History, University of South Florida
This article is republished from The Conversation under a Creative Commons license. Read the original article.

New world map makes Africa look bigger: what’s the fuss about? Cartographers explain
Jack Swab, University of Tennessee and Derek H. Alderman, University of Tennessee
The UN has passed a non-binding resolution to endorse the Equal Earth Projection, a map which more fairly represents the true size of the Earth’s landmasses. The current commonly used projection, called the Mercator Projection, greatly exaggerates land towards the north and south poles, which makes Africa look much smaller. In the Mercator projection, countries near the north and south pole can be anywhere from two to 14 times their true size. In the Equal Earth projection these distortions are minimised, making Africa look larger in comparison.
We asked Jack Swab and Derek Alderman, cartographers and geographers who study the social and communicative power of maps, to explain what’s going on.
What is a map projection?
A map projection is a technique that cartographers (map-makers) use to transform the round, three-dimensional Earth into a flat, two-dimensional map that we see on the wall or on our computer screen. As cartographers flatten the globe, the map becomes distorted, changing shapes and areas. There is no map projection that does not distort the Earth, but some projections are better suited for some uses than others.
A cartographer’s job is to choose from the hundreds of different map projections, and consider where the map is focused and how it is going to be used. No single projection is best for every use. This new Equal Earth projection is better suited than Mercator for producing global scale world maps for educational, public communication and policy purposes.
The Equal Earth supports a more accurate geographic understanding of the relative sizes of countries and continents. It provides a fairer perspective for the public to compare regions in terms of population, environment, development, politics and other global patterns.
Is the Mercator projection still useful?
While the Mercator projection isn’t good for showing the size of the Earth’s landmasses, we won’t see it totally disappear. For example, it’s very useful for navigational purposes as it maintains the accuracy of a compass bearing between two points without having to recalculate it.
This is why most online mapping platforms like Google Maps or Apple Maps rely on a variation of the Mercator projection to provide directions. Using the Equal Earth projection for navigation would not be as effective as the Mercator projection.
How will the Equal Earth projection be used?
Map-making is decentralised and there is no single authority regulating which map projection is used. What the UN did was endorse the broader message that Equal Earth is a fairer projection that more equitably displays the true size of the Earth’s land. And although this action is happening at a global level, there are movements underway in cartographic communities to make the Equal Earth projection the default world map projection.
The UN resolution by itself will not make Equal Earth a globally adopted projection. That requires intentional revision of maps used in textbooks, databases, media productions and diplomatic discussions, which requires labour and financial investment.
The Equal Earth projection was developed by cartographers and is a popular choice among map-makers since it was unveiled in 2018. It’s now possible to buy wall maps with the Equal Earth projection on them, and the projection has already been used in a wide variety of media. That said, individuals will need to opt in to using the Equal Earth projection over other types.
Why has the Equal Earth projection sparked resistance?
Resistance to the Equal Earth projection has been quite limited. There were several abstentions from the United Nations General Assembly vote, but most of this was for other reasons. Ukraine, for example, raised concerns over the depiction of the contested Crimean Peninsula on the map, which the Equal Earth Projection website depicts as contested territory.
This spurred a Russian response, along with points from other nations about contested territory. Given the UN resolution was a vote on how the world is portrayed and not about any specific political boundaries (a point that both Russia and Ukraine agreed on), these discussions amounted to geopolitical posturing about non-map issues.
The lone outlier, and only “no” vote against the Equal Earth projection, came from the United States. It claimed that the proposal was part of a “radical and ideological project” that was not appropriate for the United Nations to be debating. American delegates took issue with language linking Mercator’s distortions to colonial legacies and the marginalisation of Africa. This is not surprising since the current administration denies the existence of structural systems of inequality.
It is hard to miss the hypocrisy at play. The US wants other countries not to discuss the political implications of cartography even as President Trump engages in his own nationalist branding of the map. He has unilaterally renamed the Gulf of Mexico to the Gulf of America and Lake Ontario to Lake America for clear ideological reasons and without international consultation.
How does the new map matter when it comes to changing global views of the world?
The argument that African nations put forward was that the Equal Earth projection is a form of “cognitive justice”. Cognitive justice recognises that people often equate power and value of places with their apparent size on maps. Traditional views of Africa as a smaller continent compared to Europe or North America typically reflect the perceived importance of these parts of the world.
Equal Earth may make it easier to teach, broadcast and discuss a different view of Africa and its prominence in the world. Today, African countries are among the world’s fastest growing economies and fastest growing populations. Map projections alone cannot change people’s attitudes. Yet, as African nations seek to have more influence in international affairs, correcting the mental map of global leaders is an important step in amplifying the continent’s relevance and rights.
Jack Swab, Assistant Professor Department of Geography & Sustainability, University of Tennessee and Derek H. Alderman, Chancellor’s Professor of Geography, University of Tennessee
This article is republished from The Conversation under a Creative Commons license. Read the original article.

GIS Students Map Career Pathways
Geography and sustainability students visited the Tennessee Department of Environment and Conversation to learn how the state uses geospatial technologies.
Geography and sustainability students traveled from the University of Tennessee, Knoxville, to Nashville on September 17 for an immersive career and networking visit with the Tennessee Department of Environment and Conservation (TDEC).
The visit brought students from UT’s Geographic Information Science and Technology (GIST) program directly into TDEC headquarters to learn how geospatial technologies are used across state government and to meet professionals working in a wide range of environmental and technical careers.
Joining the students were Noel Bauer, environmental career coach, and Evan Jamison, who works in employer relations with UT’s Center for Career Development and Academic Exploration. Their participation provided opportunities to interact with students throughout the day while also building relationships with TDEC professionals who hire graduates, provide internships, and partner with universities on research and applied projects.
TDEC GIS Program Manager Jesús Ortega-Valenzuela organized the visit and welcomed the students alongside professionals representing programs including Tennessee state parks, natural areas, air pollution control, land protection, water resources, environmental response, and business information technology solutions.
Rather than focusing on a single type of GIS career, the morning featured a series of short presentations from TDEC professionals describing their educational backgrounds, career paths, current responsibilities, and the ways they use GIS and related technologies in their work. Presenters brought backgrounds ranging from GIS and geology to biology, environmental science, parks and recreation, wildlife and fisheries, and computer science.
The variety was particularly valuable for students because it demonstrated that geospatial technology is not confined to a single job title or academic pathway. GIS skills support work throughout TDEC, from managing state parks and natural resources to monitoring air quality, protecting water resources, responding to environmental incidents, and supporting agencywide technology systems.
At midday, students and TDEC staff walked together through Bicentennial Capitol Mall State Park to the Nashville Farmers’ Market for lunch. Along the way, TDEC staff highlighted details incorporated into the park’s design, including landscape features intended to represent the geography and natural environments of different regions of Tennessee.
Several TDEC employees joined the students for lunch, giving them an opportunity to continue conversations in a more informal setting.
The visit concluded with an open-house networking session at TDEC headquarters. Students met in small groups with TDEC professionals to ask questions about careers, projects, technical skills, education, and opportunities in environmental and geospatial work. The conversations were so active that the UT group ultimately had to cut the session short in order to begin the return trip to Knoxville.
The experience was designed not only to expose students to possible careers but also to help them become more comfortable interacting with working professionals and to strengthen connections among students within the GIST program.
“Seeing the students become so engaged with the TDEC staff was probably the best measure of the success of the trip,” said Michael Camponovo, GIST program director in UT’s Department of Geography and Sustainability. “By the end of the afternoon, I had to give them multiple reminders that we needed to leave because they were still networking and asking questions. That is exactly the kind of experience we want to create for our students.”
The trip also generated ideas for future collaboration between UT and TDEC involving student projects, professional development, geospatial technologies, and workforce training.
The Department of Geography and Sustainability hopes to build on the success of the TDEC visit in partnership with the Center for Career Development and Academic Exploration by creating additional employer site visits that give students opportunities to see geospatial work firsthand, explore career pathways, and develop relationships with professionals working in the field.

Place‑name politics: Why outrage alone won’t erase Trump’s name
Reuben Rose-Redwood, University of Victoria; CindyAnn Rose-Redwood, University of Victoria, and Derek H. Alderman, University of Tennessee
Local leaders in Canada’s capital city of Ottawa have initiated a process to rename Trump Avenue in response to United States President Donald Trump’s renaming of Lake Ontario as “Lake America.”
It’s not the first time Ottawa has considered renaming the street.
Shortly after Trump’s first presidential term ended on Jan. 20, 2021, Ottawa City Coun. Riley Brockington polled Trump Avenue residents to gauge their support for renaming the street.
The poll was evenly split with 21 residents in favour and 21 opposed to the renaming proposal, along with another 20 residents who did not respond. At the time, the city’s naming policy required that more than 50 per cent of a street’s residents must support a street renaming application, so the proposal to rename Trump Avenue did not proceed further.
The Trump name on the Canadian map
The issue of renaming Trump Avenue resurfaced again after Trump declared Lake Ontario would appear as “Lake America” on U.S. federal maps.
Trump’s use of place renaming to retaliate against Canada for withdrawing from trade negotiations led many Canadians to defend the name of Lake Ontario as a matter of national pride.
It’s also drawn attention to a number of geographic features in Canada that bear the Trump name. Canadian commentators have raised questions about whether places in Canada should continue to share a name with one of the most anti-Canadian presidents in American history.
According to the Canadian Geographical Names Database, there are eight geographic places that currently hold official status in Canada named “Trump.”
Examples include Trump Lake and Trump Creek in Ontario and the Trump Islands in Newfoundland and Labrador. Québec also previously had a Lac Trump (now Lac du Porc-Épic, or Porcupine Lake), and there was once a Trump post office in Manitoba. However, none of these places were named for the current U.S. president.
The larger geopolitical puzzle
The only place in Canada officially named to honour the president is Trump Avenue in Ottawa. It acquired its name more than two decades ago when Trump was best known as a New York real estate developer and Ottawa’s Central Park neighbourhood was being developed with a New York City theme.
The presence of Trump’s name in Canada’s capital city holds a different significance today due to his antagonistic policies toward Canada as president.
Renaming Trump Avenue is one piece of a larger geopolitical puzzle, since it is part of the broader effort by Ottawa’s leaders to resist U.S. threats to Canadian sovereignty and economic prosperity.
Place naming as “toponymic diplomacy”
There is a long history of cities using place renaming as a form of geopolitical communication to foreign governments. Turkish political scientist Doğuş Düzgün refers to this process as “toponymic diplomacy.”
This geopolitical use of place naming can take the form of “toponymic solidarity” to signal support for another country or “symbolic retortion,” when place names are “used as tools for sending retaliatory symbolic messages to another country,” according to researchers in the field of critical place-naming studies.
For instance, the city of Glasgow renamed a public square next to the South African Consulate-General’s office as “Nelson Mandela Place” in 1986 to express its opposition to apartheid.
More recently, a number of cities have renamed streets, squares and other public places adjacent to Russian embassies or consulates in support of Ukraine.
As Ottawa considers street renaming as diplomatic retaliation against Trump’s policies, other governments are moving in the opposite direction by naming public places in Trump’s honour, from the 655-mile President Donald J Trump Highway in Morocco to Donald Trump Avenue in Hyderabad, India.
More than simply showing support for the U.S., these renamings operate as a form of paying tribute and signalling loyalty to a leader seemingly obsessed with seeing places and institutions named after him.
In appealing to Trump’s “toponymic narcissism,” place naming is reduced to a transaction — a way for a country and its leaders to potentially gain favour in wider diplomatic and economic negotiations.
Principles and pitfalls
Trump Avenue in Ottawa exposes the pitfalls of naming places after living people, whose future actions may bring them into disrepute. For this reason, the Ontario Geographic Names Board, while having no authority over naming in municipalities such as Ottawa, doesn’t support commemorative naming until a person has been deceased for at least five years.
And now that some Ottawa leaders and citizens want to launch a diplomatic retort by removing Trump’s name from their community, making that change may not be as easy as it sounds.
Trump carried out the renaming of Lake Ontario by a unilateral executive order, but that runs counter to widely accepted principles of commemorative place renaming. Those principles suggest that when the renaming of geographic features is pursued, it should result from a deliberative process of public consultation.
Ottawa’s current commemorative naming policy includes criteria that would likely disqualify Trump place names if proposed today. Among other requirements, commemorated people are expected to have brought “honour to Ottawa, Ontario or Canada.”
Yet the same policy also makes the removal of the existing Trump street name procedurally difficult. Since the unsuccessful 2021 effort to rename Trump Avenue, Ottawa revised its policy to require over 75 per cent of the residents and property owners on an affected street to approve any renaming application.
Experiences in other North American cities suggest that obtaining that kind of super-majority in support can become a significant obstacle to street renaming.
Place names in the post-Trump era
In a post-Trump future, it’s possible some communities will remove commemorative place names honouring Trump.
One harbinger of a looming potential de-commemoration occurred in 2023 when Donald Trump Square was renamed United States Square in the Israeli city of Petach Tikvah (meaning “Gateway of Hope”) following the end of Trump’s first term in the White House.
The removal of Trump place names in the U.S. and around the world is a real possibility once his second term ends. But doing so will likely require a deliberate bureaucratic and political struggle rather than simply flipping a switch.
Reuben Rose-Redwood, Professor of Geography, University of Victoria; CindyAnn Rose-Redwood, Teaching Professor, Geography, University of Victoria, and Derek H. Alderman, Chancellor’s Professor of Geography, University of Tennessee
This article is republished from The Conversation under a Creative Commons license. Read the original article.
Research Shows Disparity in Indian Healthcare Access

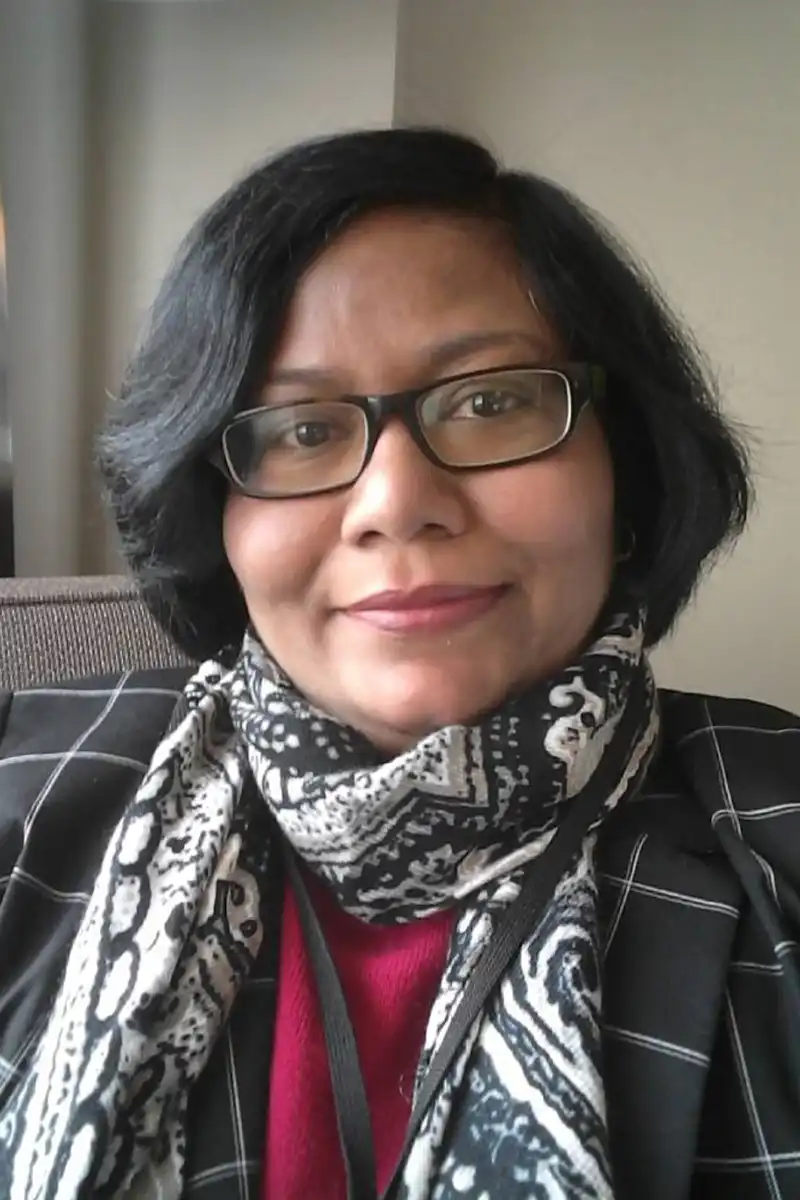
The mismatch between Mumbai’s rapid population growth and expansion of public healthcare facilities is detailed in a new international collaborative study co-authored by human geography and sustainability Professor Madhuri Sharma from the University of Tennessee, Knoxville.
“Spatial analysis shows that heavily populated wards are frequently bereft of sufficient public healthcare facilities, and that specialized services are dispersed across a few select wards, thereby perpetuating existing inequalities,” Sharma and Assistant Professor Sujayita Bhattacharjee of S.I.W.S. College, Mumbai, India, wrote in the Romanian Journal of Geography.
Among Mumbai’s 24 municipal wards, densely populated suburban areas are the most medically underserved, while specialized medical institutions are concentrated in the city’s older southern and central wards, their analysis found.
The authors attribute the inequalities to Mumbai’s historical patterns of urban growth and development, rapid urbanization, socioeconomic disparities across communities, inadequate urban planning, and overall low public healthcare expenditures even in fast-growing metropolises like Mumbai.
“These findings highlight the need for targeted ward-level health planning with an emphasis on the more populated areas,” Sharma said.
“Minimizing such disparities is critical for improving health and well-being not only for Mumbai, but also for the most populated nation in the world, as a healthy nation is critical for an economically productive nation,” she said.
by Amy Beth Miller
Hurricanes devastated Florida’s East Coast – then seagrass made an unexpected comeback
Stephanie Insalaco-Wyner, Southwestern University and Hannah V. Herrero, University of Tennessee
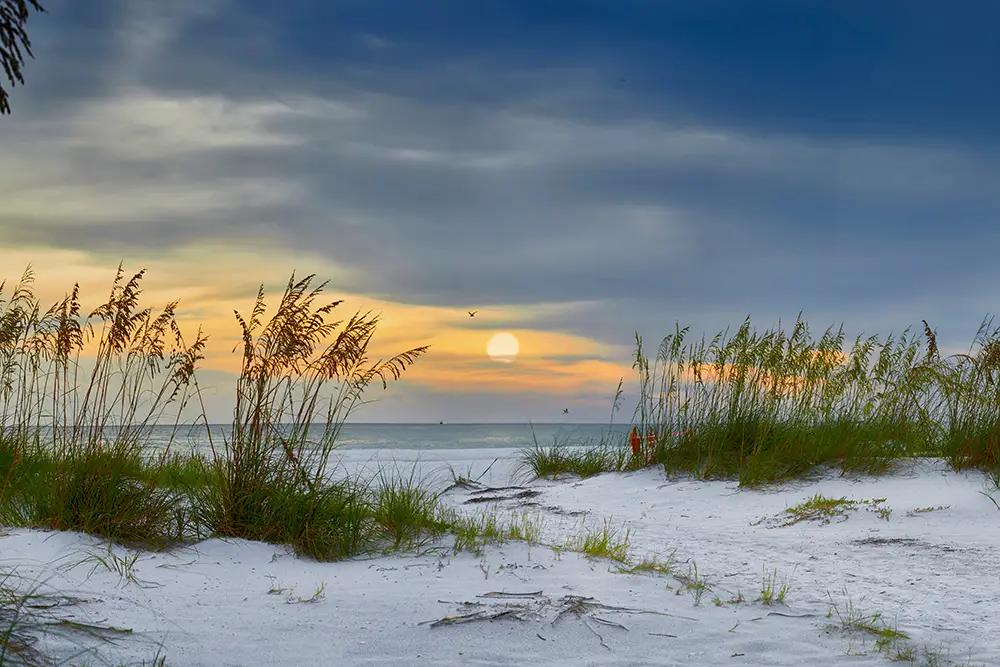
Florida’s Indian River Lagoon has been an ecosystem in decline going back to 2011, when harmful algal blooms led to a severe decline in seagrass, the foundational component of shallow coastal ecosystems.
Seagrass meadows stabilize sediments, improve water clarity and provide critical habitat and forage for species ranging from invertebrates to sea turtles and manatees. Seagrass also generates a significant amount of economic activity in the state of Florida.
The loss of seagrass in the Indian River Lagoon System undermined fisheries, tourism and wildlife, ultimately leading to the starvation of more than 1,200 manatees from 2020-25, peaking in 2021-22.
Mosquito Lagoon is part of the Indian River Lagoon system that spans 28 miles (45 kilometers), running from Cape Canaveral in the south up to Ponce Inlet in the north. As in the rest of the lagoon system, years of nutrient pollution and recurring algal blooms had diminished seagrass cover to nearly zero by the early 2020s. By most accounts, Mosquito Lagoon had crossed a critical ecological tipping point.
In the fall of 2022, hurricanes Ian and Nicole struck Florida’s east coast within six weeks of one another, bringing intense rainfall, storm surges and coastal erosion. In the immediate aftermath, seagrass declined even further.
But a few months later, in the spring of 2023, seagrass began to return. Satellite imagery revealed rapid and widespread regrowth.
We are geographers who study environmental change. Our research documents this unexpected recovery and examines what it may reveal about ecosystem resilience in heavily degraded coastal systems.
One of us, Hannah Herrero, is a Volusia County native who grew up around the lagoon. She returned to her hometown at the outset of the COVID-19 pandemic. It was there that some local guides and fishermen she’d known for years suggested that our team should use satellite imagery to look at the state of collapse in the lagoon.
The study we designed as a result used satellite imagery and machine learning, a type of artificial intelligence that uses advanced algorithms to learn and predict patterns, to track seagrass dynamics in Mosquito Lagoon before, during and after the storms. This approach allowed us to observe change at a scale and frequency that is difficult to achieve using only traditional field survey methods.
Tracking seagrass from space
Monitoring seagrass coverage “the old-fashioned way” involves going into the lagoon and laying out transects, straight lines that cut through a landscape, so standard observations could be recorded. We would then have to boat or wade all along those lines to measure seagrass extent and locations and create digital maps manually to show where it is present.
As you can imagine, this is a time-intensive process that’s limited by how far you can boat or swim in a day, and by financial resources.
So we decided to use satellite imagery instead. This method is not without its own challenges – water turbidity, or cloudiness, seasonal variability and the patchy nature of vegetation that grows on the bottom of the lagoon all make it difficult to observe seagrass growth directly on the imagery.
To address this challenge, our study used imagery from NASA’s Harmonized Landsat–Sentinel program, which combines data from multiple satellites into a consistent record of photos of the same areas taken frequently over time. We analyzed imagery collected between September 2022 and January 2024, focusing on periods before and immediately after the hurricanes and throughout the subsequent recovery.
We applied a type of machine learning model called Random Forest to classify each image into seagrass and nonseagrass categories.
The machine learning algorithm is informed by training samples collected in the field, but once the model has learned the signature of seagrass, it is able to then apply the classification model to the rest of the lagoon and across time with limited human input. We can then validate this classification.
Heading into the field
First, we had to train the model using hundreds of GPS points collected in the field over multiple seasons. This step helps to ensure that satellite classifications align with on‑the‑ground conditions and are accurately interpreting the images.
Over several weeks during the summers of 2020 through 2023, our team spent many hours navigating Mosquito Lagoon in a small skiff designed for shallow depths, recording seagrass presence.
It wasn’t always easy – Florida summers are intensely hot and humid, and Mosquito Lagoon definitely lived up to its name. But we got to see a wide variety of wildlife, including manatees, dolphins, sea turtles and alligators. And occasionally, on lucky days, we even spotted a roseate spoonbill or reddish egret.
Our experience in the field highlighted why this system matters: Mosquito Lagoon is a remarkably vibrant place, teeming with wildlife. These long days on the lagoon, surrounded by its biodiversity and immersed in its unique sense of place, are what anchor the remote sensing data to on-the-ground ecological conditions and make the resulting models credible.
What we found
Our analysis reveals three distinct phases of seagrass coverage.
First, seagrass declined sharply following hurricanes Ian and Nicole. By December 2022 and early 2023, satellite imagery showed virtually no detectable seagrass across the lagoon.
Then, in March 2023, we identified a statistically significant shift. Seagrass began to reappear, initially in small, scattered patches.
Finally, during late spring and summer 2023, seagrass expanded rapidly. By July 2023, it covered more than 20% of the lagoon – levels not observed in more than a decade. Coverage then declined again during the winter of 2023–24, as expected based on seasonal growth cycles. But even our last observation, completed in January 2024, showed seagrass covering 4.3% of the lagoon, substantially higher than pre-recovery levels during the winter season.
In spring 2026, seagrass in Mosquito Lagoon has remained at stable levels. Although it still experiences fluctuations due to algal blooms, seasonality and other changes in the ecosystem, we have not seen a complete loss of seagrass again like what was occurring for over a decade.
Importantly, this pattern was not random. Regrowth occurred primarily in the central and southern parts of the lagoon, areas historically known to support dense seagrass meadows. The timing also aligned with established seagrass seasonal growth patterns, which strengthens our confidence that the observed changes reflect true ecological recovery.
How storms may have contributed
We cannot prove that hurricanes directly caused the seagrass recovery that we document in our study. Further study beyond the scope of our work is needed to evaluate this possibility. However, we believe the sequence of events suggests that the storms may have altered environmental conditions in ways that enabled regrowth.
Hurricane Ian delivered large volumes of fresh water into the lagoon, potentially suppressing salt‑tolerant macroalgae that compete with seagrass for sunlight and nutrients.
Six weeks later, Hurricane Nicole breached coastal dunes and created several new inlets between the lagoon and the Atlantic Ocean. These openings allowed salt water into the lagoon, likely altering salinity and changing water circulation and conditions.
The hurricanes may also have redistributed seagrass fragments and mobilized dormant seed banks, accelerating regrowth once conditions stabilized. Ecologists have observed similar mechanisms in other coastal systems affected by tropical cyclones.
Beyond Mosquito Lagoon
Mosquito Lagoon’s collapse and eventual tentative recovery illustrates both the vulnerability and resilience of coastal ecosystems. Even after years of decline, the Mosquito Lagoon coastal ecosystem demonstrated an ability to recover relatively rapidly when physical conditions shifted.
At the same time, resilience does not guarantee permanence, and we believe this recovery should be viewed cautiously.
From a practical standpoint, our study also highlights the value of satellite imagery and machine learning for ecosystem monitoring. These tools allow scientists, resource managers and local communities to detect change consistently and respond before losses spread.
Stephanie Insalaco-Wyner, Assistant Professor of Geographic Information Sciences, Southwestern University and Hannah V. Herrero, Associate Professor of Geography, University of Tennessee
This article is republished from The Conversation under a Creative Commons license. Read the original article.

As renaissance fairs become big business, can they retain their counterculture roots?
Katrina Stack, University of Tennessee and Reagan Yessler, Pellissippi State Community College
Within moments of entering the Newport Renaissance Faire, you are ushered to a group of fairies. They pass you a scroll and say, “You must seek out the Bone Man for the first hurdle in your quest.” As you navigate the fair, you find many men dressed in bones, both vendors and fellow attendees. When you find the correct Bone Man – an actor wearing what appears to be a mask made of human skull along with a crown constructed from deer antlers – he stamps your scroll. He then sends you to your next target: the Drunk Viking.
Following the directions of actors in the fair, you meet a variety of performers from many historical eras and fantastic realms, and stumble upon both merchants and merrymakers in your journey. It’s all part of the immersive experience that connects you with the other guests and staff, though many of the costumed staff members, speaking in faux Middle English, are also trying to sell you something.
Renaissance fairs were originally conceived as a creative refuge for artists sidelined by political repression during the Red Scare. Now, they sit at an uneasy crossroads between countercultural expression and commercial spectacle. Having grown into a nationwide industry with tiered tickets, branded merchandise and multimillion dollar valuations, the fairs can easily be seen as an offshoot of a corporate theme park.
As cultural geographers, we wanted to learn more about whether the spirit of the fairs has been changing. So for our recent study, we visited the Tennessee Renaissance Festival, Newport Renaissance Faire, Tennessee Medieval Faire and Tennessee Pirate Fest.
Once upon a time … not so long ago
Although renaissance fairs and festivals recreate the atmosphere of centuries past, the first formally recognized fair took place in May 1963 in Irwindale, California. A public school English and history teacher named Phyllis Patterson was the brains behind the event, which she dubbed the Renaissance Pleasure Faire.
For Patterson, the fair was a chance to celebrate the era’s countercultural values like free expression, experimentation with identity and creative play. It also served as a source of employment for those who had been pushed out of their careers in the film and entertainment industries after being blacklisted or graylisted as suspected communists.
Patterson herself had refused to sign a Cold War–era loyalty oath required to work in California public schools. At the Renaissance Pleasure Faire, actors, educators and set designers could continue their craft, whether that meant designing costumes, creating characters, performing or writing.
From creative refuge to thriving business
Since those first events in Southern California, renaissance fairs have spread across the U.S., with some constructing permanent structures even though they’re only open seasonally, in the spring or fall. Built to resemble small villages, fair operators create towns-within-towns, fantasy lands where visitors can briefly step away from their routines and obligations.
Their popularity continues to grow, and what began partly as a creative refuge has grown into a thriving entertainment business.
The East Tennessee Renaissance Faire recently announced that it would be relocating after deciding that its original venue in Newport could no longer accommodate the swelling crowds: Within three years, the fair had grown from 600 to 6,000 attendees, spurring a move to a larger site in neighboring Sevierville. New fairs are sprouting up as well: The Chattanooga Renaissance Faire will host its inaugural season in spring 2026.
There are almost always entry fees – US$38 at the Tennessee Renaissance Festival and $53 at the Renaissance Pleasure Faire, for example – and many offer season passes.
Attendees often arrive in costume, but strict rules about adhering to a specific time period or setting rarely apply.
Some visitors dress as Tolkien-style elves, while others show up as Tudor nobles. Viking-clad participants walk alongside fairies and swashbuckling pirates. Some fairs have also developed their own themed weekends – with names like “Viking Victory,” “Fantasy and Folklore,” “Pirate Plunder” and “Celtic Celebration” – that weave history and fiction with few constraints. And those committed to their role will often address each other in playful faux-medieval speech, with greetings like “my lady” or “my lord.”
Vendors, often dressed in costume themselves, sell everything from cloaks, swords and crowns to contemporary jewelry and shampoos. Booths sell era-adjacent fare like Scotch eggs, ciders, mead and turkey legs, while modern cocktails like “The Shipwreck” and “The Blueberry Faerie” can also be had, with visitors paying the equivalent of stadium and arena concession prices.
Renaissance fairs have even spread to countries like Germany and France, reconnecting with their roots. The expansion into new venues – along with the development of offshoots such as pirate- and steampunk-themed festivals – point to profit margins that would have been unthinkable in the early days of the Renaissance Pleasure Faire.
But as with many ventures, the prospect of cashing in comes with complications.
The 2024 HBO Max series “Ren Faire” introduced viewers to the eccentrics and costume-clad vendors involved in the nation’s largest fair, the Texas Renaissance Festival in Todd Mission. The fight over its future involved lawsuits and, eventually, the court-ordered $60 million sale of the event’s property and assets.
King Richard’s Faire, which takes place in Carver, Massachusetts, and is the largest fair in New England, reportedly generates massive daily revenue while allegedly relying on widespread worker misclassification, leaving many performers earning below minimum wage without benefits. Even volunteer “villagers” work only for free admission, and both workers and attendees receive no compensation or refunds when the fair closes due to rain.
Seeking out a space of whimsy
Despite the creeping influence of profit motives, we concluded that renaissance fairs have always been – and continue to be – mostly about community.
Dressing as a fantastical version of yourself or your favorite character bonds you to others dressed up at the festival. Unlike popular Civil War or World War II reenactments where historical accuracy is paramount, renaissance fairs instead invite people to take part in shared, often mythologized ideas about history through performance, costume and play.
For example, each weekend, the Tennessee Renaissance Festival organizes jousts. Competitors and their horses meet at a permanent jousting pitch located at the back of the property. Each knight represents a noble house, and each section of the bleachers is assigned a knight to root for. Announcers explain the rules of each event, while also leading the crowds in chants and cheers. While the knights might fight under titles tied to historical lineages, they represent a jumble of eras and place. They also reject antiquated social norms by including women and ethnic groups who never would have been seen together on a jousting pitch.
Here, fidelity to the facts is an afterthought; it actually might ruin the fun.
Beyond the jousting pitch, you can find the queen dictating a game of human chess. A rotating cast of performers play music, tell jokes, juggle and blow fire. Elsewhere, you might stumble across pixies teaching children how to make fairy homes or relax in a mermaid’s magical grotto.
There’s also a comforting simplicity in the narratives of this make-believe world. Ladies are almost always gentle and beautiful, while the men are brave and noble. All the villains are easy to spot – they’re always defeated.
In a real world characterized by political upheaval, information overload, invisible surveillance and shadowy villains, perhaps the fair, with its simple prism of good and evil, becomes a space of comfort – a curated cultural experiment that’s also an improvised escape.
In other words, renaissance fairs wield a quiet power: They forge communities that deliberately blur fantasy, history and everyday life with a wink. Vendors, performers and attendees alike can be Tudors, Vikings, hobbits, elves or mermaids for a day. Few actually believe in elves, or imagine their mock-Elizabethan speech is anything more than cheerful, mangled guesswork.
And that’s the point. There’s joy in pretending – just as there’s a universal pleasure in the weird, the whimsical and the absurd.
Katrina Stack, Ph.D. Candidate in Human Geography, University of Tennessee and Reagan Yessler, Adjunct Professor of Human Geography, Pellissippi State Community College
This article is republished from The Conversation under a Creative Commons license. Read the original article.

The Department of Geography and Sustainability is pleased to announce the S. David Freeman Sustainability Scholarship, applications now open!
The S. David Freeman Sustainability Scholarship will recognize and support outstanding undergraduate students majoring or receiving a degree in sustainability. The scholarship honors S. David “Dave” Freeman, a University of Tennessee alumnus and nationally recognized leader in energy policy whose work influenced environmental and energy decisions across multiple U.S. presidential administrations and major public utilities.
The scholarships will be awarded to rising juniors and seniors in the Department of Geography and Sustainability. This is designed to recognize academic excellence, encourage leadership in sustainability, and prepare students to address complex environmental and energy challenges in Tennessee, across the nation, and around the world.
Awards to be given:
- $750 Travel Award for study abroad, conferences, workshops etc. that are related to sustainability. (Application below)
Due: April 6, 2026

Freeman’s connection to UT began while he was working as a civil engineer at the Tennessee Valley Authority (TVA) in the 1950s. He pursued a law degree through night classes, graduating at the top of his class in 1956. His legal training shaped a career focused on public policy, energy regulation, and environmental protection. Raised in Chattanooga, Freeman was the son of Eastern European immigrants and later became a highly influential voice in U.S. energy policy.
He served with the Federal Power Commission during the Kennedy administration and held advisory roles in the Johnson, Nixon, and Carter administrations, as well as with the U.S. Senate Commerce Committee. In 1974, he led a Ford Foundation project that produced A Time to Choose: America’s Energy Future, a landmark report advocating energy conservation and warning of climate change risks decades before the issue gained widespread attention.
President Jimmy Carter appointed Freeman to the TVA Board in 1977, where he served until 1984 and chaired the board for much of that time. He halted several nuclear projects, expanded renewable energy programs, and strengthened pollution controls on coal plants, earning national recognition, including the National Wildlife Federation’s Conservationist of the Year award. Freeman later led the New York Power Authority, the Los Angeles Department of Water and Power, and the Sacramento Municipal Utility District, advancing environmental initiatives and modernizing energy systems.
Known as the “Green Cowboy,” Freeman remained an advocate for clean energy into his 90s and chronicled his work in his autobiography, The Green Cowboy: An Energetic Life.
The S. David Freeman Sustainability Scholarship honors his legacy by supporting students committed to sustainability, public service, and environmental leadership—helping prepare the next generation of leaders to build a more sustainable and resilient future.

- 1
- 2
- 3
- …
- 6
- Next Page »